Section heading
Highlight 1
Highlight 2
Highlight 3



Heading
Value 1
Label 1
Value 2
Label 2
Value 3
Label 3
Section heading
Add the section description.

Section heading
Heading
Value 1
Label 1
Value 2
Label 2
Value 3
Label 3
Section heading
Section heading
Section heading
Heading
Value 1
Label 1
Value 2
Label 2
Value 3
Label 3
Highlight 1
Highlight 2
Highlight 3
Section heading
Section heading
Section heading
Add the section description.
Heading
Value 1
Label 1
Value 2
Label 2
Value 3
Label 3
Section heading
Heading
Value 1
Label 1
Value 2
Label 2
Value 3
Label 3




Making healthcare data trustworthy at scale

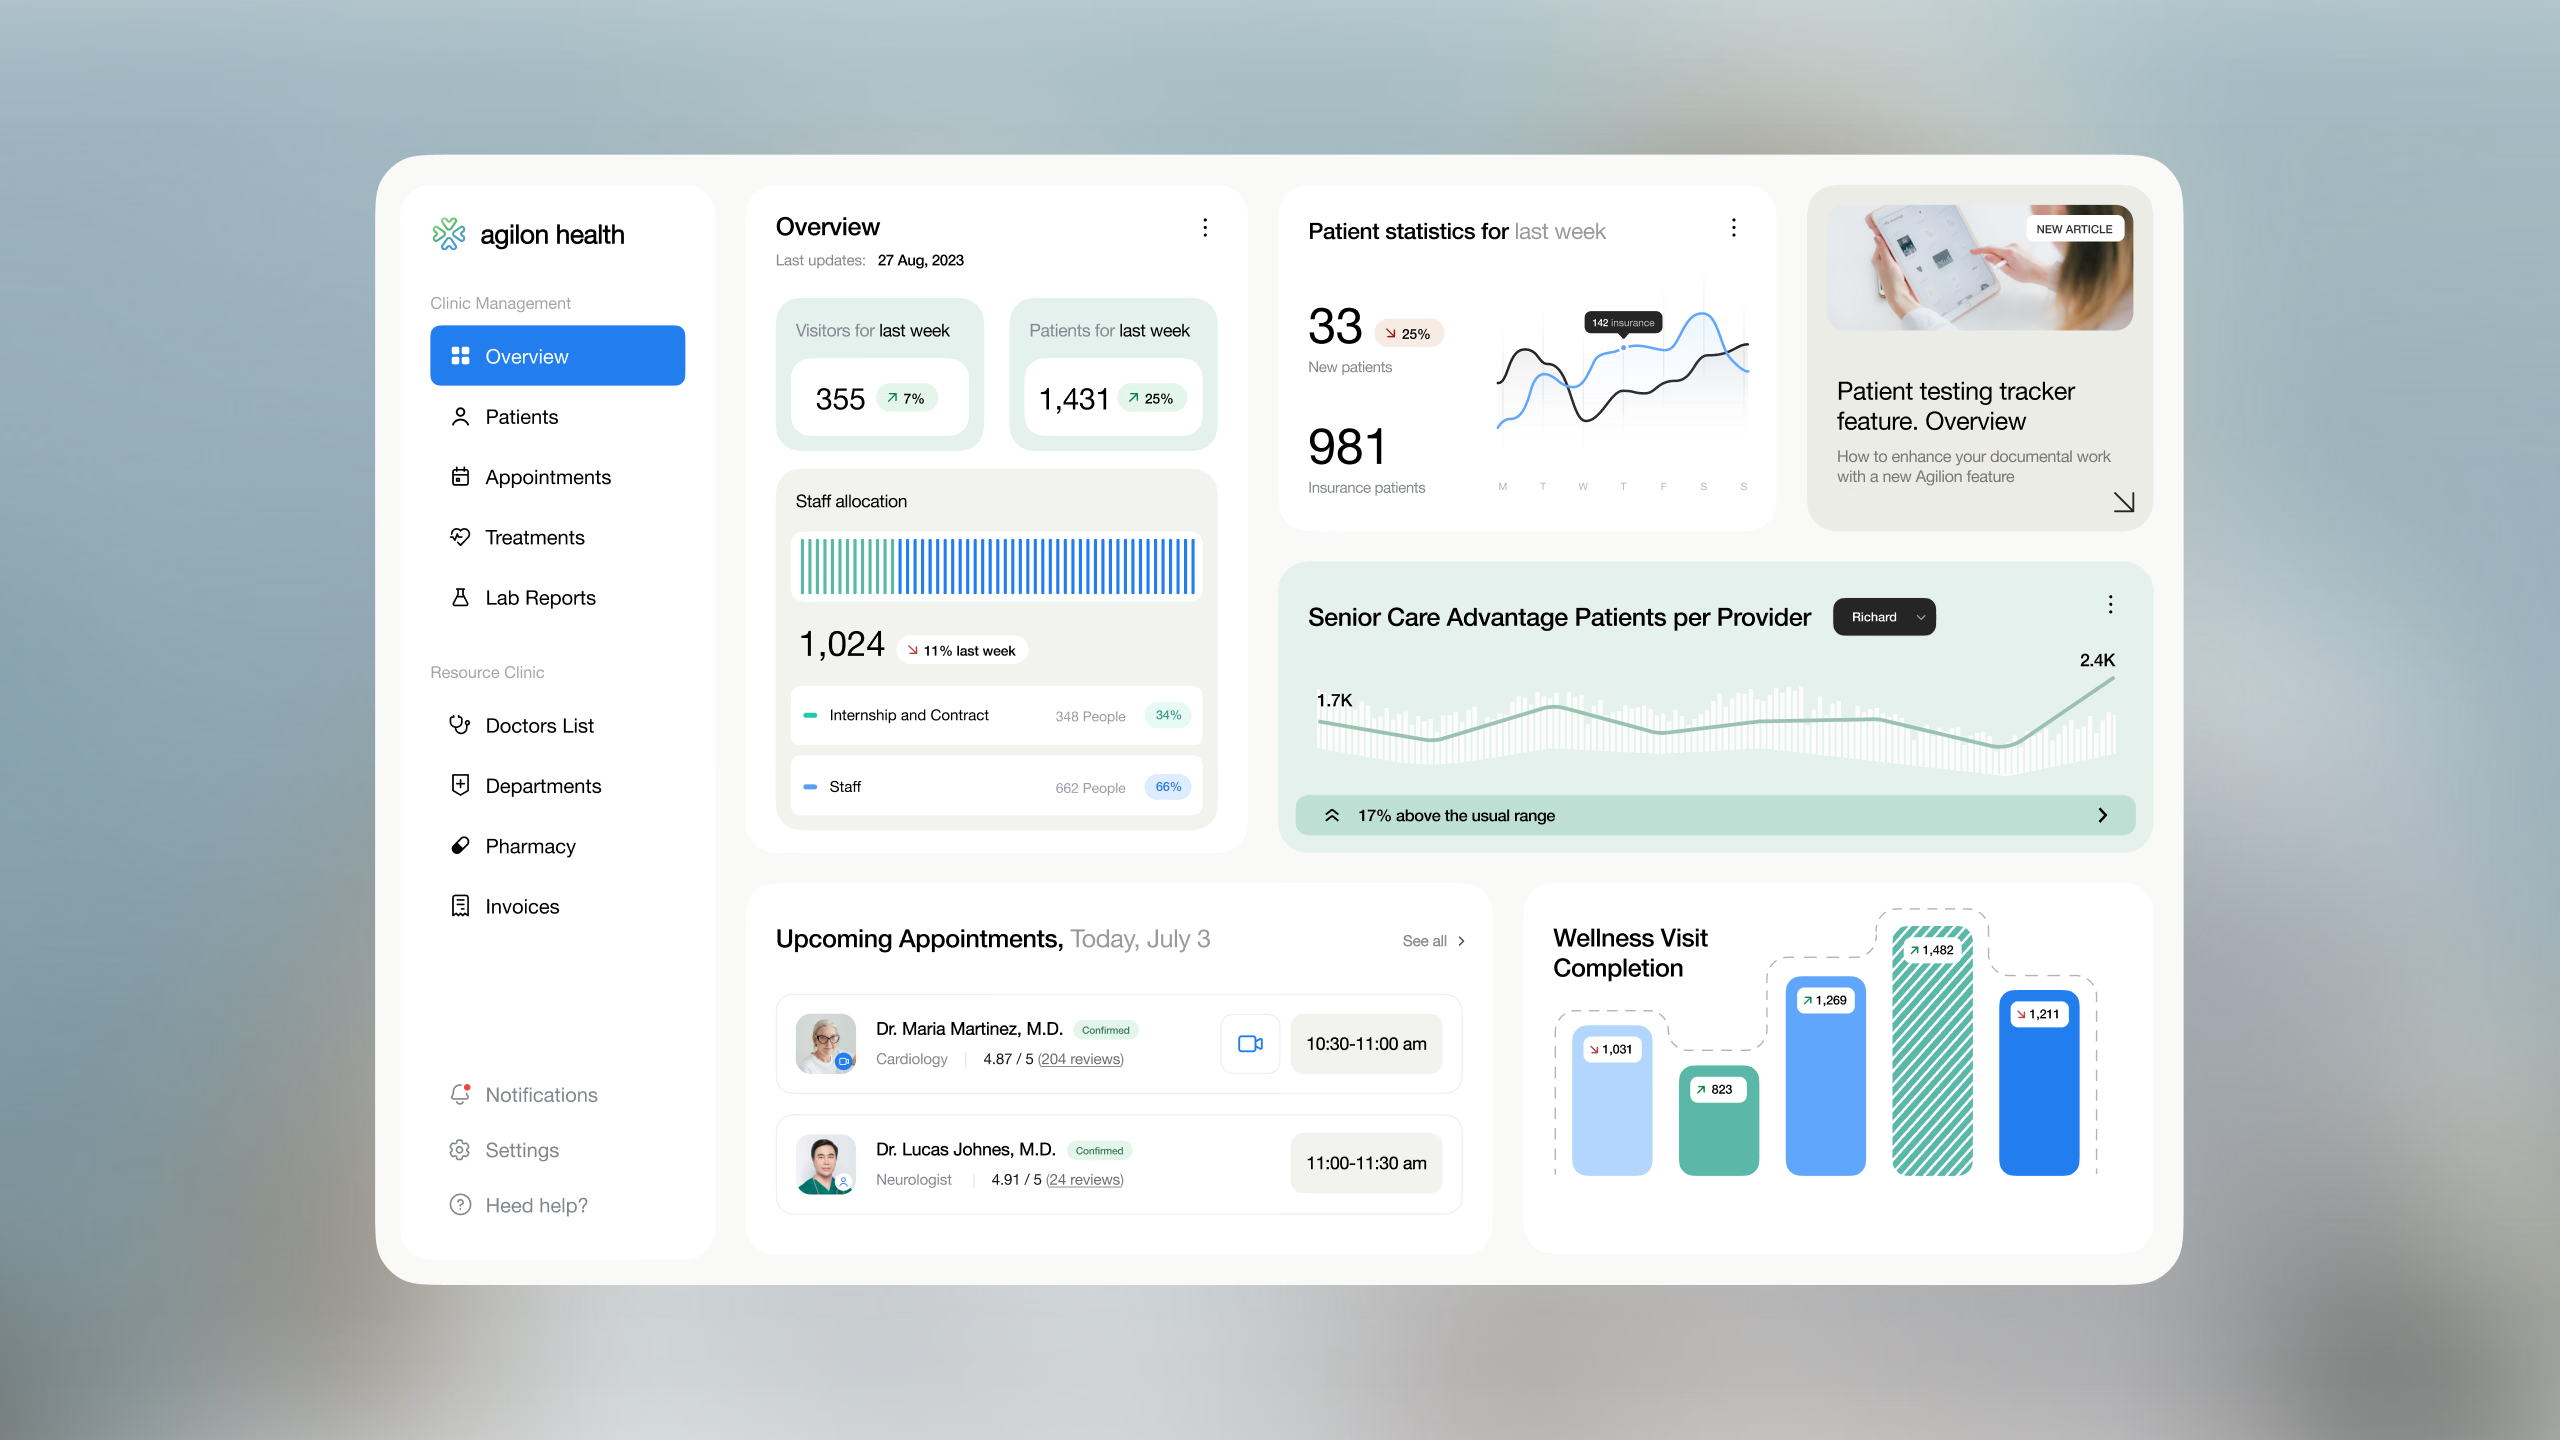
Agilon’s physicians and operators needed a clear view of performance across 53+ clinic sites. We turned their changing spreadsheets into a shared source of truth, with automated reporting and a history of every update.
Unified reporting across 53+ clinic sites, replacing fragmented spreadsheets with a shared platform.
Preserved historical data so corrections never erased the basis of earlier reports.
Delivered reporting across markets, pods, and clinics, with access controls designed for HIPAA requirements.
Agilon’s analysts spent more than 80% of their time manually gathering and reconciling data. Physicians, pod leaders, and operators had partial views of performance, with no shared place to work from the same numbers.
Automating that process was only part of the challenge. Source spreadsheets changed: membership records disappeared, monthly totals were corrected, and later uploads could alter the meaning of earlier reports.
The system needed to make current data useful while preserving the history behind every report.
A business intelligence system built on physician and clinic data
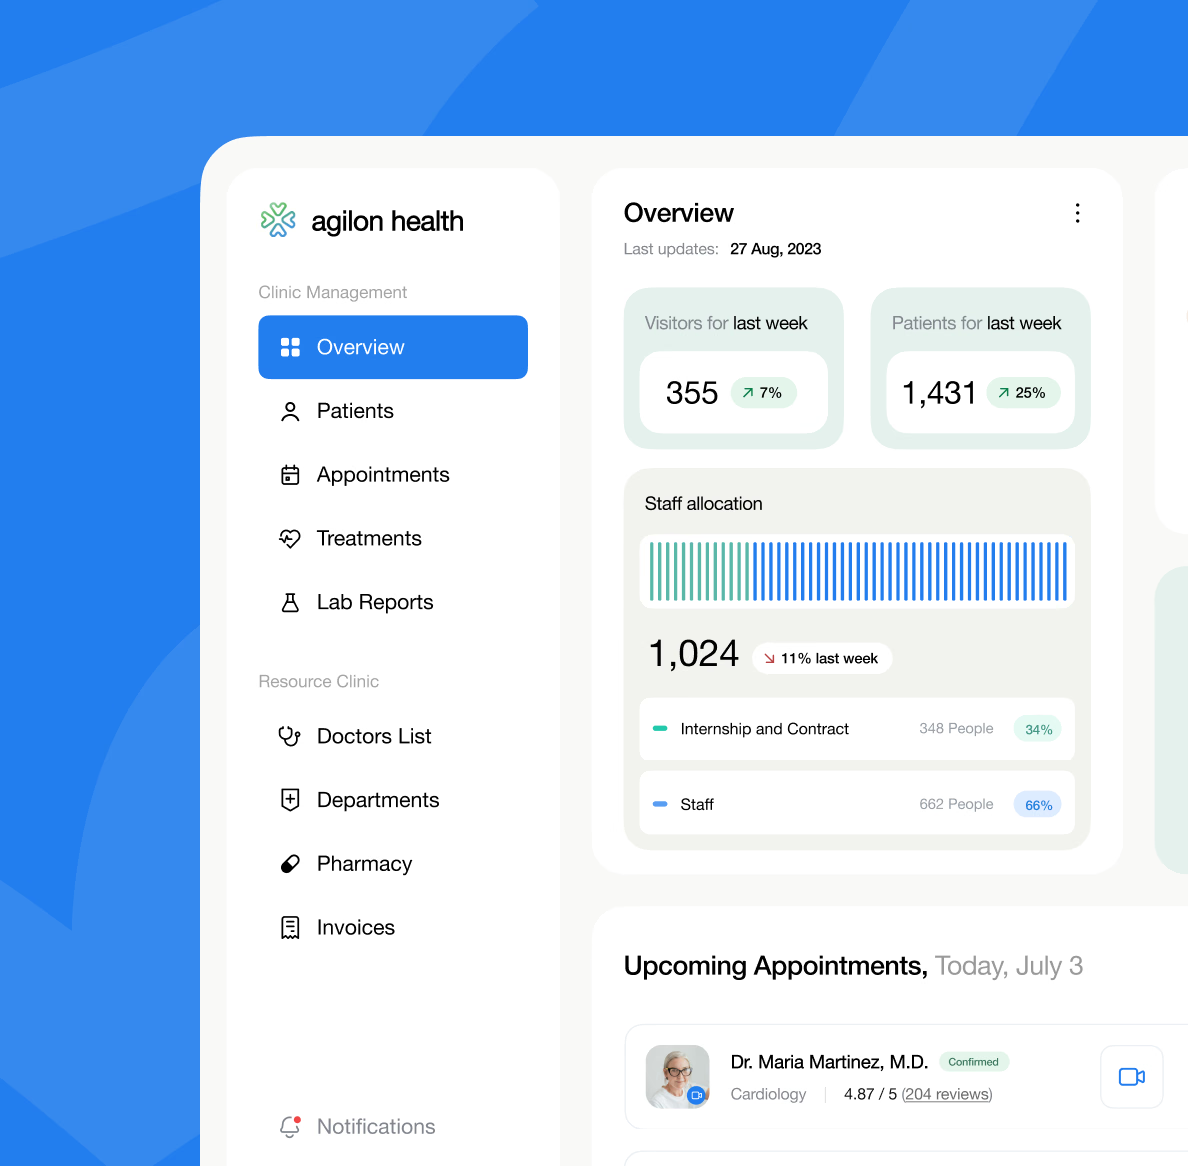
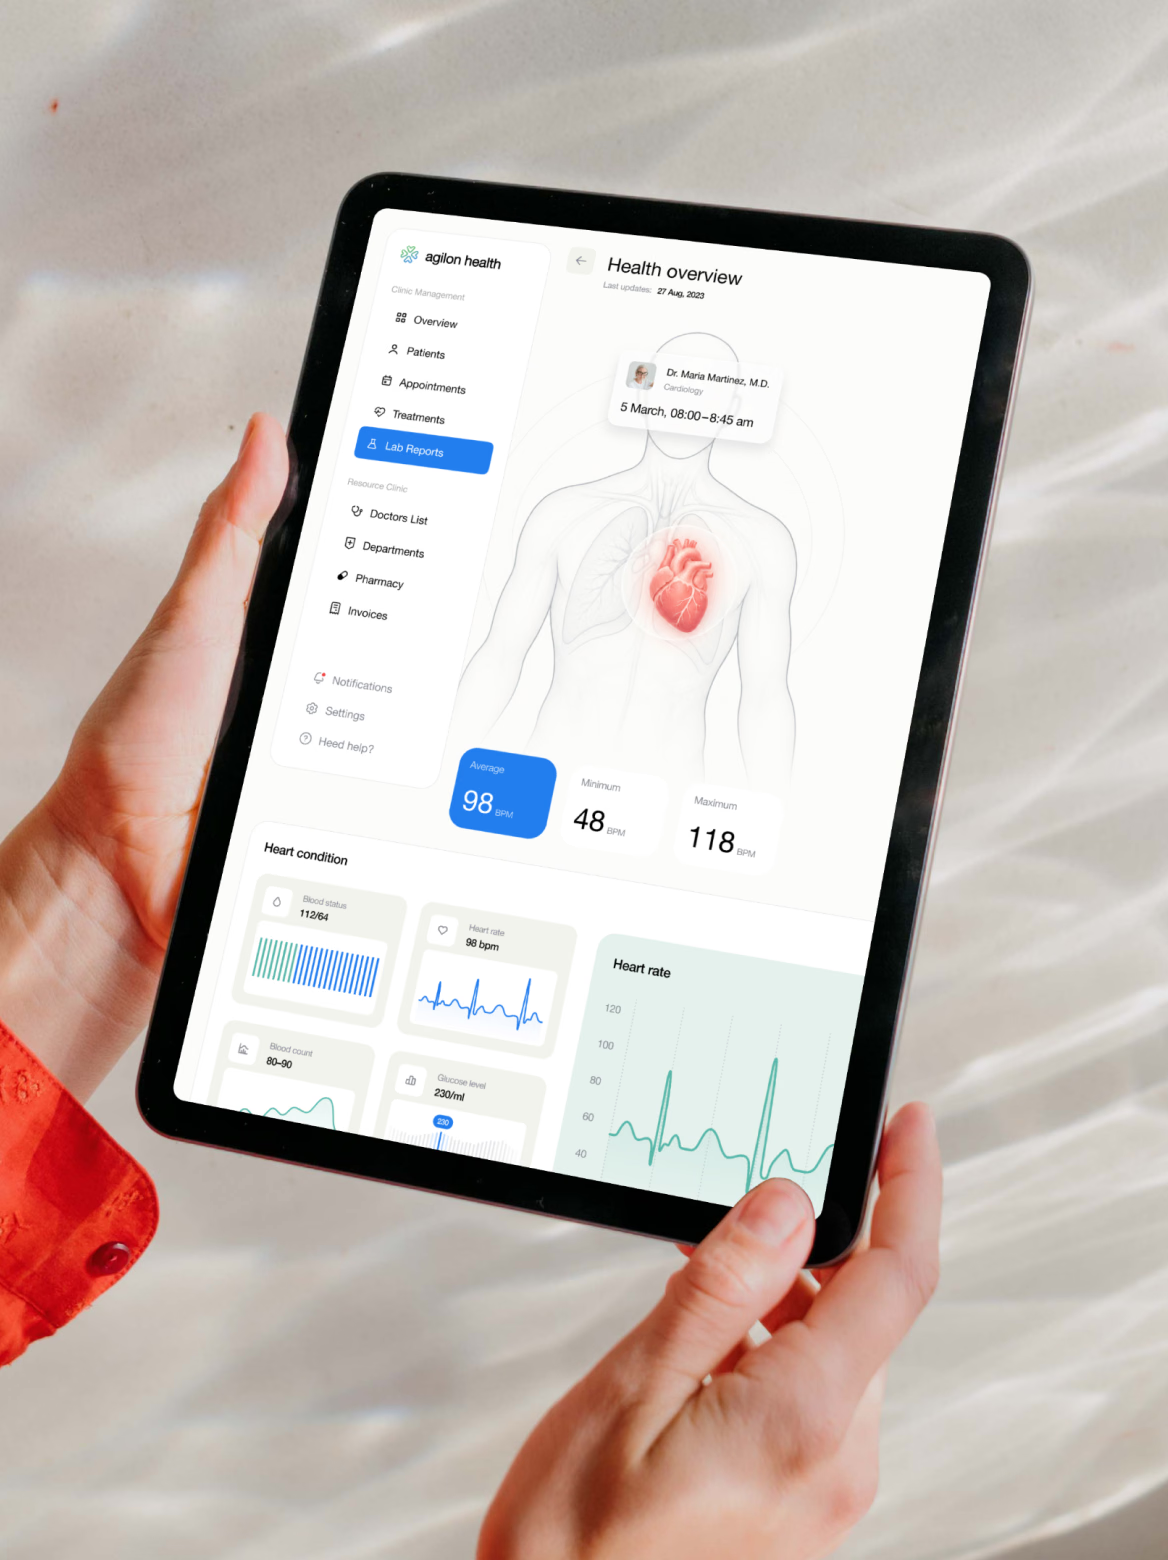
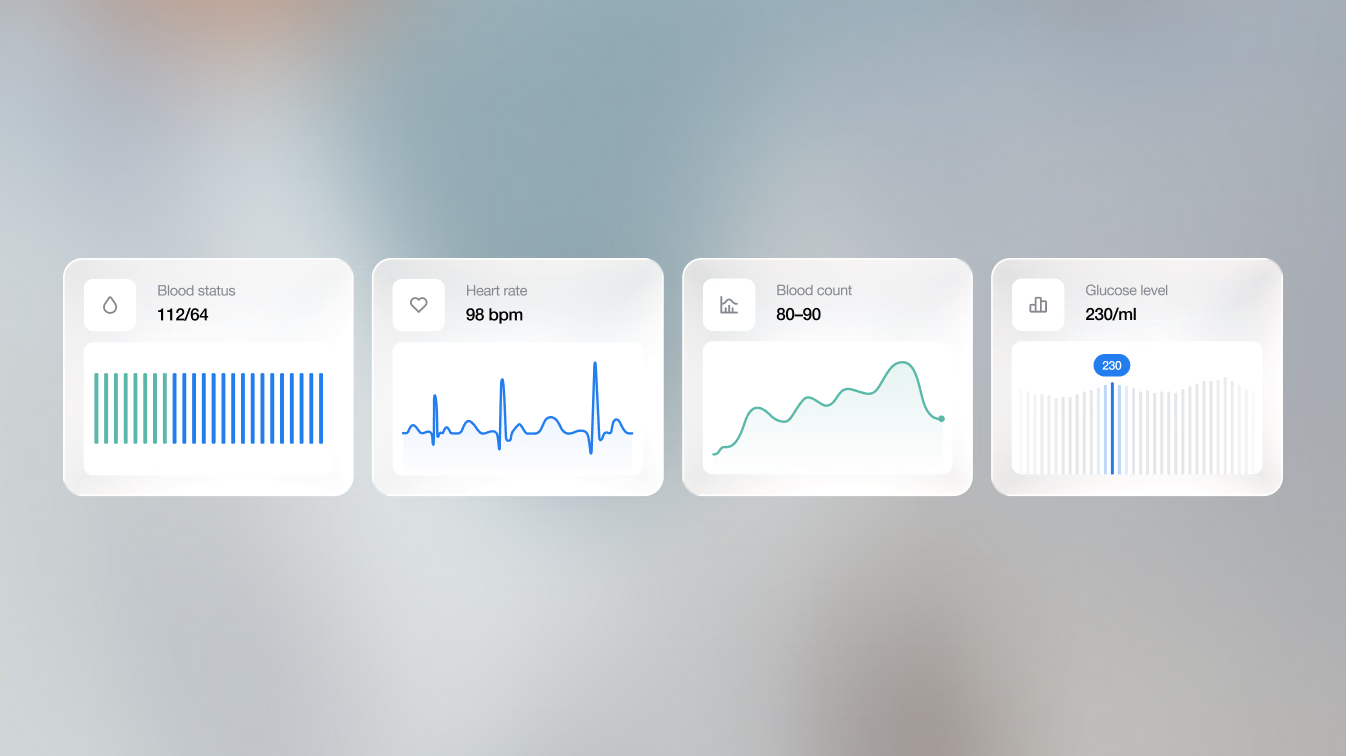
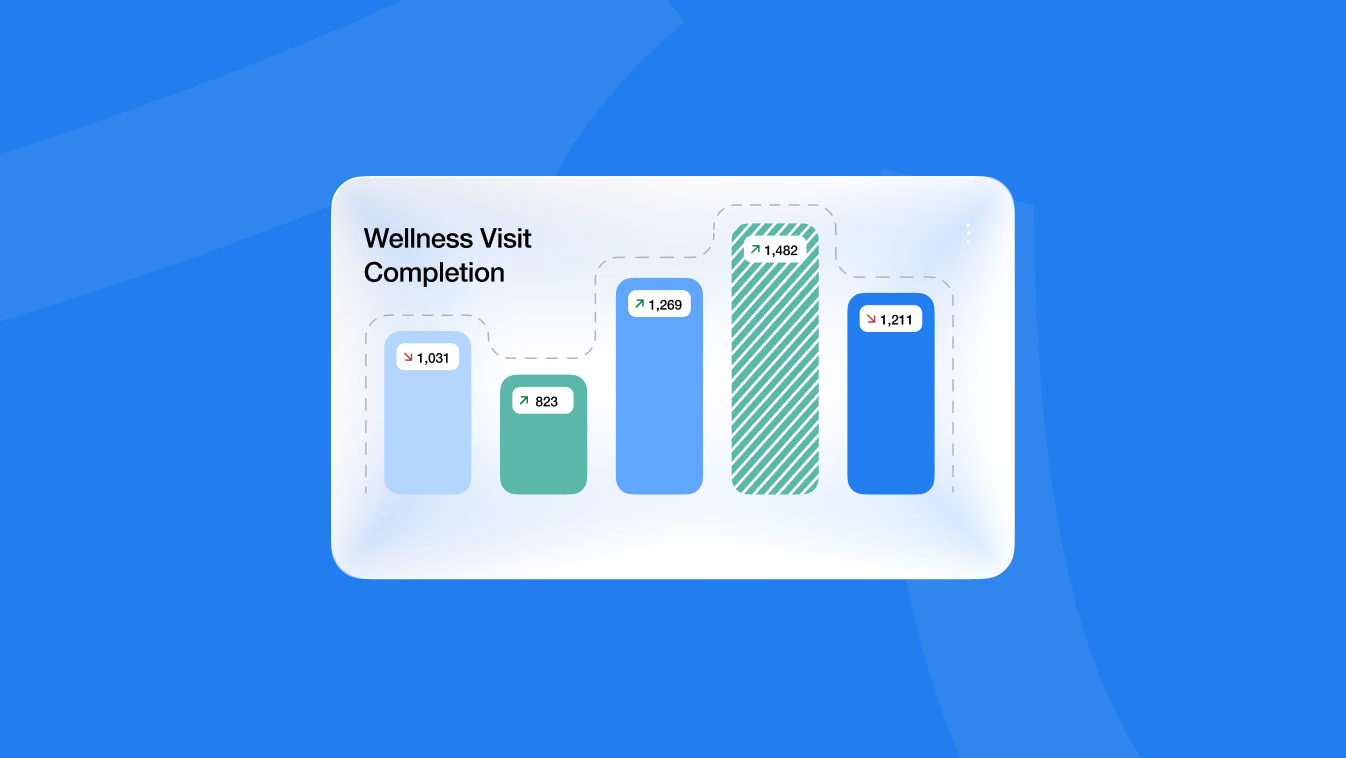
We built a system that ingests Agilon's spreadsheet data and turns it into reports and dashboards physicians and operators actually use, with views at the market, pod, and clinic level.
New data arrives, history stays intact
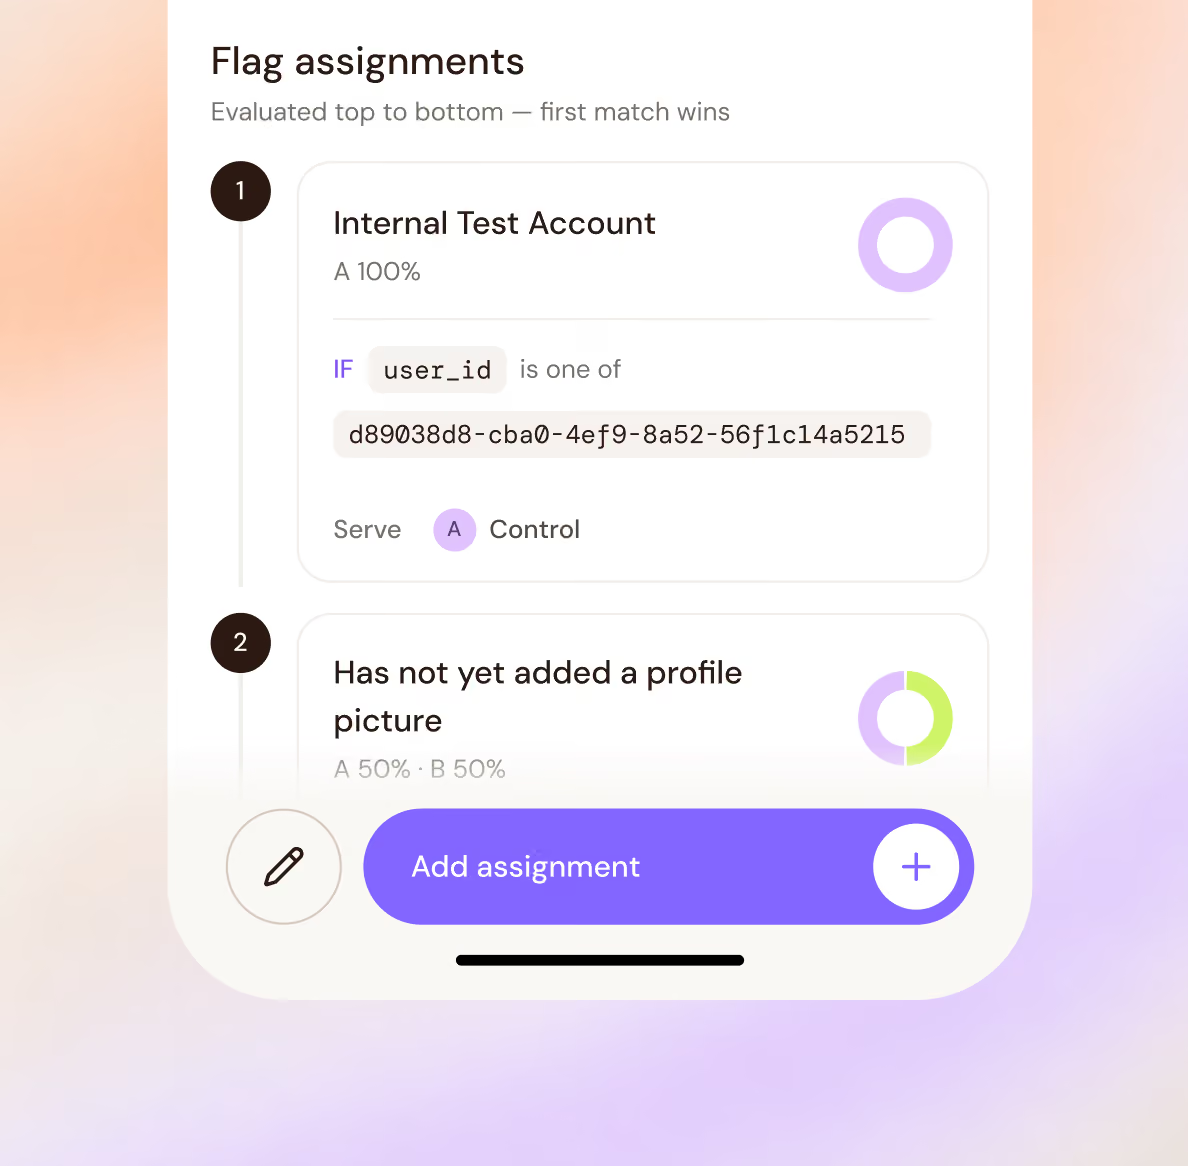
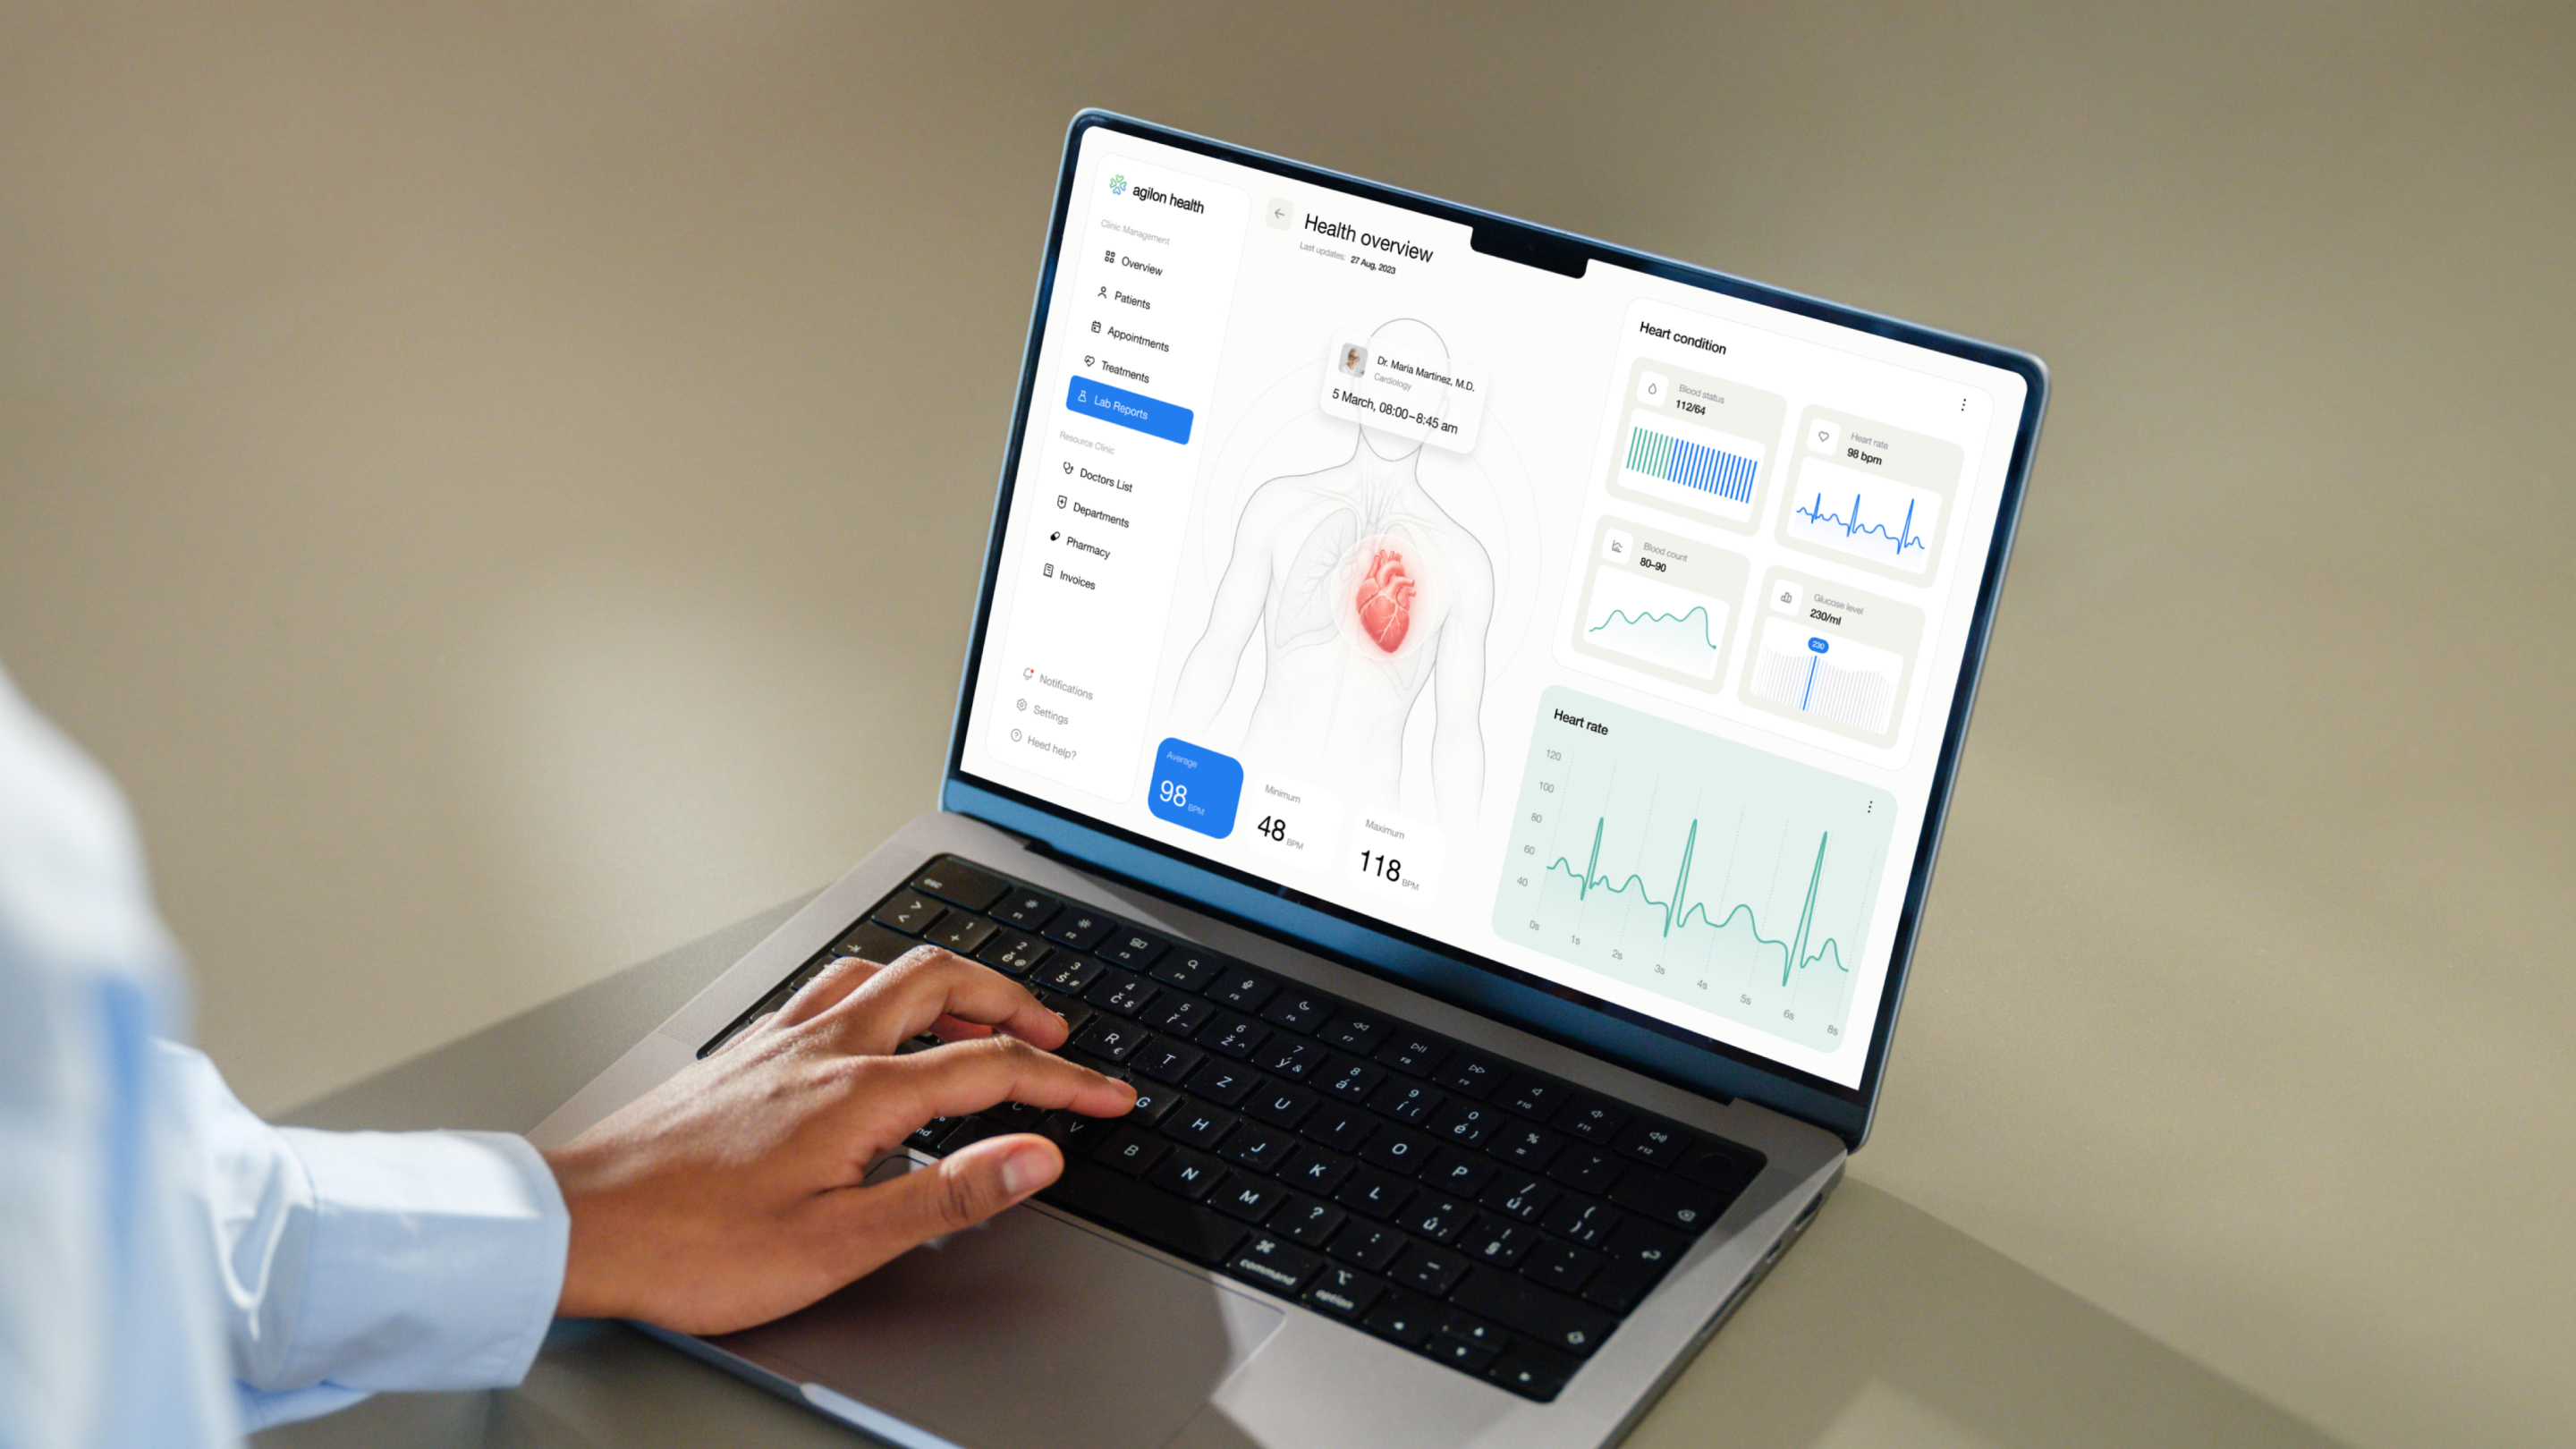
Each upload becomes a new timestamped snapshot. Earlier versions remain preserved, even when the source data is corrected or replaced. Reports can reflect the information available at a chosen point in time, allowing teams to revisit earlier results and trace the data behind them.
Preserve the evidence behind every report
The snapshot model was central to the platform’s design. A complete membership list and a rolling monthly metric behave differently. One may replace the previous list; the other may revise figures from earlier months.
We designed the data layer to handle both without overwriting the recorded history.
That gave Agilon a way to incorporate corrections while retaining the information needed to reconstruct what users saw on a given day.

“Fluxon brought a fresh perspective and new expertise at an impressive pace that enabled us to make meaningful change to our business. The entire team has been a pleasure to work with.”
Trusted data at national scale
We replaced fragmented reporting with a shared platform for physicians and operators, automating data gathering and preserving the history behind every report.
53 clinics connected
One platform for consistent reporting across markets, pods, and clinics.
Analyst time back
Automated data gathering freed teams to focus on analysis and decisions.
Nationwide rollout
rollout across Agilon's clinic network
.avif)